Read event performance from the dashboard
Use the event dashboard for a quick operational view before deeper finance reconciliation.
Steps
- Open Services > Events.
- Open the event.
- Select Dashboard.
- Review the attendance, check-in, revenue, order, and page-view totals, and the breakdowns by origin, price category, and start time.
- Compare the dashboard with Attendees, Orders, and Documents when totals are used for finance.
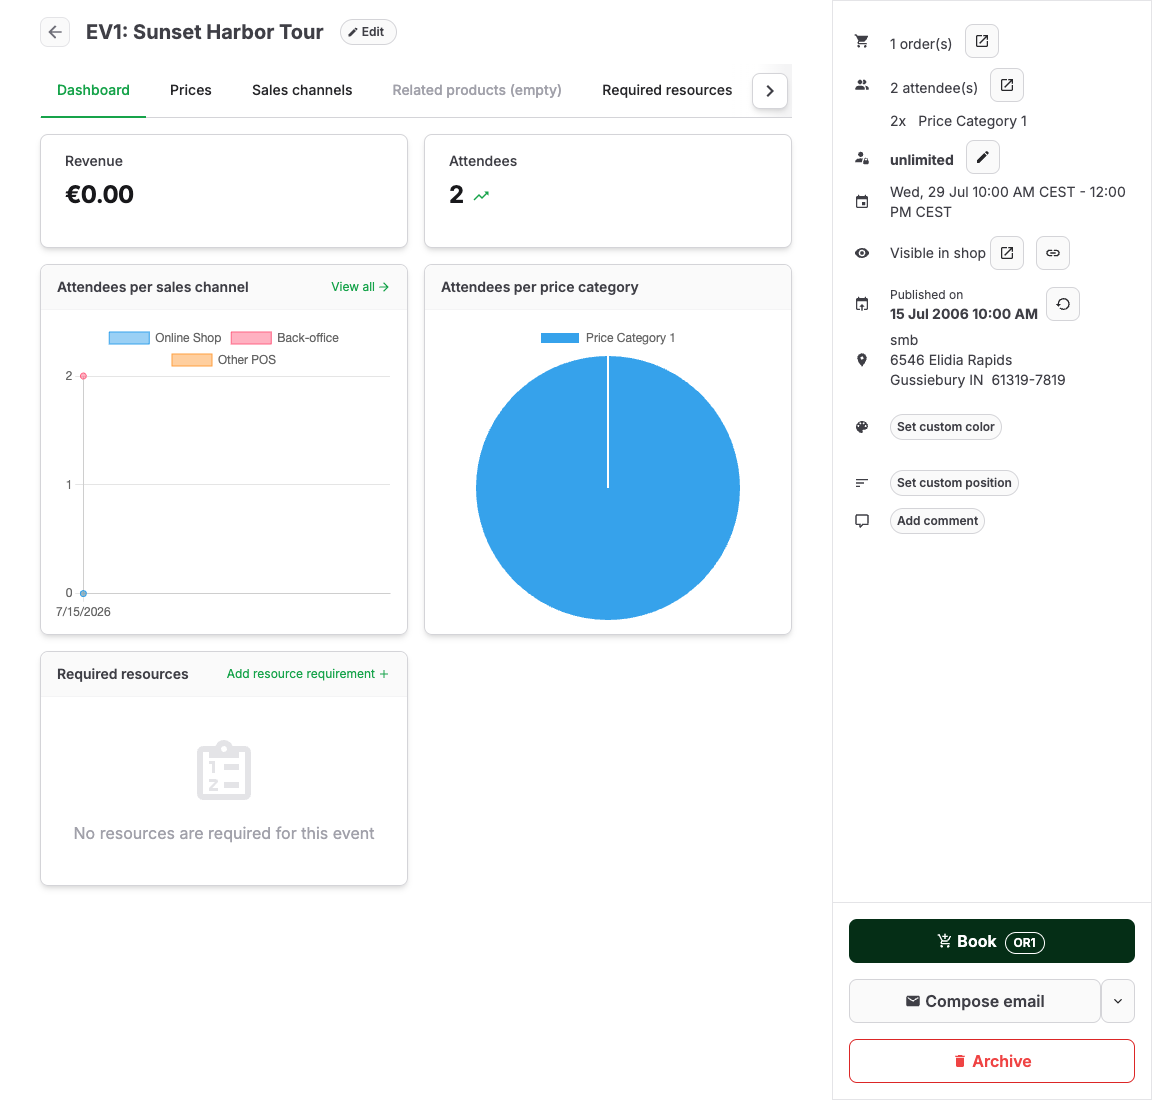
Read common totals
| Total | What to remember |
|---|---|
| Attendance count | Counts booked attendees, including paid, unpaid, and staff-created bookings. |
| Checked in | Shows checked-in attendees as a count and percentage of booked attendees. Reserved and canceled attendees, and attendees removed from an order, are excluded. |
| Revenue | Can differ from attendance because of free tickets, refunds, vouchers, and unpaid orders. |
| Orders | Counts orders, not attendees; one order can contain several attendees. |
| Page views | Counts shop page visits for the event, not attendees or sales. |
The Attendees widget shows Checked in X of Y below the booked total and links to the attendee list filtered to checked-in attendees. The linked list shows removable chips for the event, Checked in, and Booked. The Booked chip keeps the list aligned with the dashboard count by excluding reservations, cancellations, and attendees removed from an order; it remains visible if you remove the other chips, and you can remove it or clear all filters when you intentionally need a wider list.
A zero stays visible so you can distinguish “nobody checked in” from missing data. The price-category chart shows the same booked-versus-checked-in comparison in its summary and tooltips. While the dashboard is visible, check-in totals refresh automatically; the attendance widget shows when its live check-in value was last calculated.
Reserved attendees are not included in either side of the checked-in ratio until the reservation is booked. Canceled attendees and attendees removed from an order are also excluded from both sides. Capacity is shown on the event itself and in the capacity diagnostic, not as a dashboard widget.
Expected result
You can explain event performance and know which list to open for detail.
Troubleshooting
| Problem | What to check |
|---|---|
| Revenue does not match attendees | Free tickets, refunds, vouchers, canceled attendees, and unpaid orders. |
| Capacity looks wrong | Event capacity, resource requirements, sales channel limits, and existing reservations. |
| Check-in numbers look too low | Open the checked-in attendee link, then review scanner coverage, manual check-ins, and late scans. |
