Understand dashboard totals
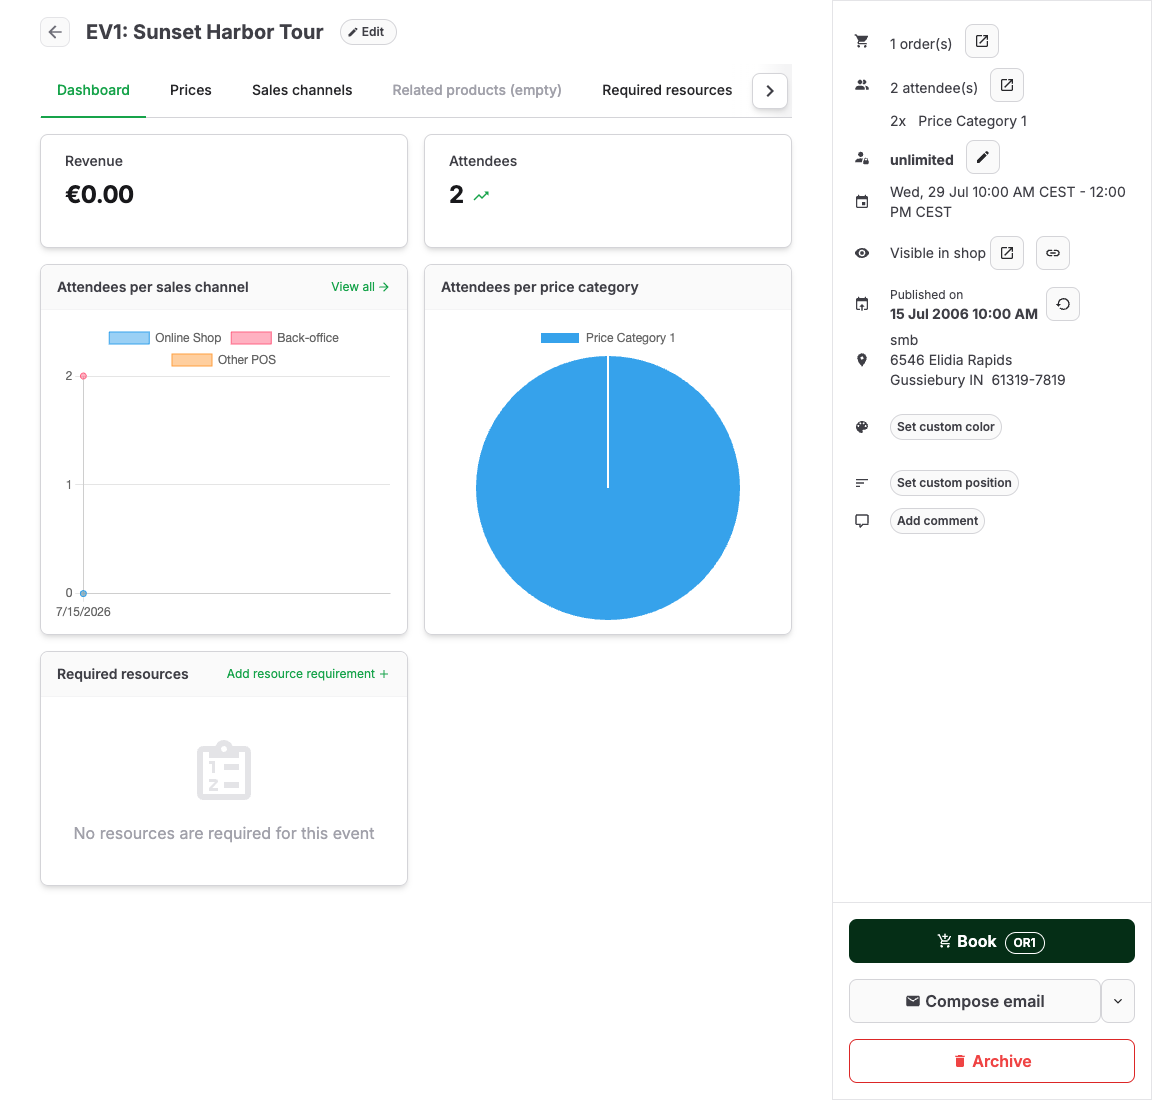
This article explains what the main back-office Dashboard shows and how each number is counted, so you can tell whether a difference from a list or report is a problem or a definition. For the dashboard on a single event, read Read event performance from the dashboard instead.
The main widgets
The default dashboard shows these tiles; the exact set can differ per account:
| Widget | What it counts |
|---|---|
| Revenue | The gross value of documents and POS receipts issued in the last 4 weeks, compared with the 4 weeks before. |
| New customers | Customer records created in the last 4 weeks, compared with the 4 weeks before. |
| Shop views | Online shop page visits today, compared with the same weekday last week. Views, not orders. |
| Expected visitors | Booked attendees whose visit starts today, including imported or manually added attendees, compared with the same weekday last week. |
| Orders per sales channel | Orders over time, grouped into Online shop, Back-office, and Point of sale. |
| Upcoming events | Today's events with their participant counts. |
Orders per sales channel is the dashboard's exact label for a high-level POS-origin grouping. It is not the configurable order channel A classification stored on an order to identify how it entered KORONA Event and support routing, reporting, and defaults such as point of sale or payment method. stored on an order or the sales-channel rule An offer rule that selects one or more points of sale and controls where, when, and with what channel-specific limit the offer can be sold. that makes an offer sellable.
Below the tiles, the dashboard lists Orders to be shipped, and, where enabled for your account, Allocations needed and Withdrawals requiring review.
Each number uses its own date basis
Revenue is counted on the date the invoice or receipt was issued. Expected visitors is counted on the visit date. New customers is counted on the date the customer record was created. A ticket sold today for an event next month raises Revenue today and Expected visitors next month — that is not a mismatch.
Attendees, tickets, orders, and revenue count different things
- One order can contain several attendees, so order counts are lower than attendee counts.
- Expected visitors counts booked attendees regardless of payment state, whether they came from an order, an import, or a manual addition; reserved and canceled attendees are excluded. An overnight or multi-day visit is counted on its start date, not on every day it overlaps.
- Expected visitors is not a ticket-scan total. Entry-system totals use the time of actual admission, so no-shows and tickets scanned on a different date can make the daily figures differ.
- Revenue counts issued documents. Free tickets add attendees but no revenue, and a discounted ticket adds less revenue than its price category suggests.
- Shop views counts page visits and has no fixed relationship to orders or revenue.
Common decisions
- "Is today busy?" — Use Expected visitors and Upcoming events, then open the attendee list for detail.
- "Are sales up?" — Use Revenue and Orders per sales channel for the trend, and a revenue report for exact figures per event or day.
- "Why did revenue jump without new visitors?" — Check for sales of future events, vouchers, or products: they raise Revenue now but not today's Expected visitors.
- "Why does the dashboard differ from my export?" — Compare the time window (rolling 4 weeks versus your filter) and the date basis before anything else.
